Update 2012-01-09: I have now been able to understand the poor(ish) results in this benchmark. They are very likely due to a bad hardware setup and neither Galera nor InnoDB is to blame. See https://openlife.cc/blogs/2012/january/re-doing-galera-disk-bound-bench…
After getting very good results with Galera with using a memory bound workload, I was eager to then also test a disk bound workload. Also this time I learned a lot about how Galera behaves and will try to share those findings here.
Setup
The setup for these tests is exactly the same as in last weeks benchmarks, except that I've now loaded the database with 10 tables containing 40 million rows each. This sums up to about 90GB database:
mysql >select table_name, table_rows, avg_row_length, data_length / (1024 * 1024) "table_size (MB)" ,

index_length / (1024*1024) "index_size (MB)", data_free/(1024*1024) "data_free (MB)" FROM

information_schema.TABLES where table_schema="sbtest";

+------------+------------+----------------+-----------------+-----------------+----------------+

| table_name | table_rows | avg_row_length | table_size (MB) | index_size (MB) | data_free (MB) |

+------------+------------+----------------+-----------------+-----------------+----------------+

| sbtest1    |   40000067 |            224 |       8570.0000 |        924.0000 |        11.0000 |

| sbtest10   |   40000067 |            224 |       8570.0000 |        930.0000 |        11.0000 |

| sbtest2    |   40000067 |            224 |       8570.0000 |        927.0000 |        11.0000 |

| sbtest3    |   40000067 |            224 |       8570.0000 |        936.0000 |        11.0000 |

| sbtest4    |   40000067 |            224 |       8570.0000 |        928.0000 |        11.0000 |

| sbtest5    |   40000067 |            224 |       8570.0000 |        931.0000 |        11.0000 |

| sbtest6    |   40000067 |            224 |       8570.0000 |        935.0000 |        11.0000 |

| sbtest7    |   40000067 |            224 |       8570.0000 |        935.0000 |        11.0000 |

| sbtest8    |   40000067 |            224 |       8570.0000 |        935.0000 |        11.0000 |

| sbtest9    |   40000067 |            224 |       8570.0000 |        935.0000 |        11.0000 |

+------------+------------+----------------+-----------------+-----------------+----------------+

10 rows in set (2.33 sec)


((8 570 + 924) * 10) / 1 024 = 92.7148438
I also decreased the InnoDB buffer pool to 9000M, which is roughly 10% of the database size. To illustrate the effect of the buffer pool size I also did runs with 18000M buffer pool, roughly 20% of the database size.
Before we start, it should be said that purely from a MySQL and InnoDB perspective, this is not a perfectly tuned database. I'm using a single InnoDB tablespace and not file-per-table. I'm not using partitions, which could also be helpful with such large tables. So we are just focused on the effect of Galera and its various parameters.
Results from a single node
Like last time, we start by running sysbench oltp against a single node with Galera disabled. Blue, red and yellow are with a 9g buffer pool, green with 18g.
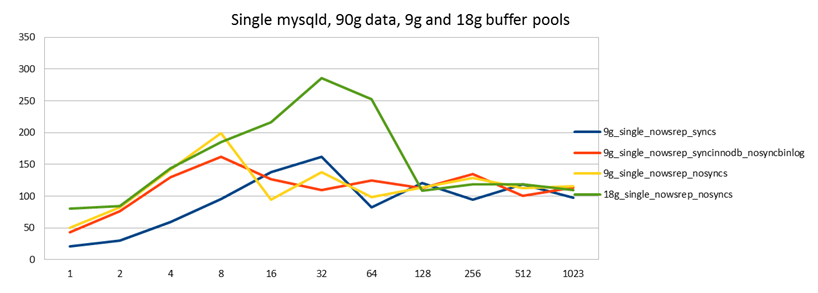
What we can clearly see from the results is that more than anything else, the performance is determined by how much of the data can be cached in RAM. There's no MySQL setting you can tune that can give you more performance the same way that buying more RAM will do.
When we look at the 3 different 9g tests, we see that apart from a small peak at 8 client threads, all of the results are pretty much the same. This is because in a disk bound workload, the limiting factor in this read-write benchmark is not how many write IOPS the disk can do, rather the random disk seeks needed to fetch InnoDB pages into memory (after which the records can be updated, then written back). So this is why it doesn't make a big difference whether you do an fsync or not, because you are more limited by reading than writing. This will turn out to be a significant observation going forward too.
Starting the Galera cluster
So let's now start our other 2 nodes:
[cluster129]# time ./mysql-galera -g gcomm://cluster130 start

Starting mysqld instance with data dir /data/c/mysql-5.1.57-galera-0.8.1-x86_64/mysql/var and listening at port 3306 and socket /data/c/mysql-5.1.57-galera-0.8.1-x86_64/mysql/var/mysqld.sock...........................................................................................

...........................................................................................................

...........................................................................................................

...........................................................................................................

...........................................................................................................

...........................................................................................................

...........................................................................................................

...........................................................................................................

...........................................................................................................

...........................................................................................................

...........................................................................................................

...........................................................................................................

...........................................................................................................

...........................................................................................................

...........................................................................................................

...........................................................................................................

...........................................................................................................

...........................................................................................................

...........................................................................................................

...........................................................................................................

...........................................................................................................

................................................... Done (PID:12394)

Waiting for wsrep_ready. Done

real	38m33.323s

user	0m8.677s

sys	0m29.197s


[cluster127]# time ./mysql-galera -g gcomm://cluster130 start

Starting mysqld instance with data dir /data/b/mysql-5.1.57-galera-0.8.1-x86_64/mysql/var and listening at port 3306 and socket /data/b/mysql-5.1.57-galera-0.8.1-x86_64/mysql/var/mysqld.sock...........................................................................................

...........................................................................................................

...........................................................................................................

...........................................................................................................

...........................................................................................................

...........................................................................................................

...........................................................................................................

...........................................................................................................

...........................................................................................................

...........................................................................................................

...........................................................................................................

...........................................................................................................

...........................................................................................................

...........................................................................................................

...........................................................................................................

...........................................................................................................

...........................................................................................................

...........................................................................................................

...........................................................................................................

...........................................................................................................

...........................................................................................................

...........................................................................................................

...........................................................................................................

...........................................................................................................

...........................................................................................................

...........................................................................................................

...........................................................................................................

...........................................................................................................

...........................................................................................................

...........................................................................................................

...........................................................................................................

...........................................................................................................

...........................................................................................................

...........................................................................................................

...........................................................................................................

...........................................................................................................

...........................................................................................................

...........................................................................................................

...........................................................................................................

...........................................................................................................

....... Done (PID:25817)

Waiting for wsrep_ready. Done

real	72m5.771s

user	0m16.799s

sys	0m48.960s
When the nodes join the cluster Galera notices that they are not in sync with the database we have on the third node (called "cluster130"). So they launch an "SST" (State transfer?). The default SST method is mysqldump, but here I've changed to rsync since I don't want to see a mysqldump file of a 90GB database! The rsync takes 38 min for the first node, the second has to wait for its turn and then finishes in a total of 72 min. You can see the rsync happening with ps:
[cluster130]# ps aux|grep rsync

root     10700  0.0  0.0  63848  1068 pts/1    S    16:56   0:00 sh -c wsrep_sst_rsync 'donor' '172.xx.xxx.xx:4444/rsync_sst' 'root:rootpass' '/data/d/mysql-5.1.57-galera-0.8.1-x86_64/mysql/var/' '3ec9d3ea-c67c-11e0-0800-d9f41c3c2786' '0' 2>sst.err

root     10701  0.0  0.0  63852  1148 pts/1    S    16:56   0:00 /bin/bash -ue /data/d/mysql-5.1.57-galera-0.8.1-x86_64/mysql/bin/wsrep_sst_rsync donor 172.xx.xxx.xx:4444/rsync_sst root:rootpass /data/d/mysql-5.1.57-galera-0.8.1-x86_64/mysql/var/ 3ec9d3ea-c67c-11e0-0800-d9f41c3c2786 0

root     10708 35.8  0.0  68448  1364 pts/1    R    16:56   3:13 rsync -rlpgoDqI --whole-file --inplace --delete --exclude *.err --exclude *.pid --exclude *.sock --exclude *.conf --exclude core --exclude galera.* --exclude grastate.txt --exclude *.[0-9][0-9][0-9][0-9][0-9][0-9] --exclude *.index /data/d/mysql-5.1.57-galera-0.8.1-x86_64/mysql/var// rsync://172.xx.xxx.xx:4444/rsync_sst

root     10773  0.0  0.0  61168   720 pts/1    D+   17:05   0:00 grep rsync
All of that happens automatically just by starting the new nodes.
During the first 38 minutes this database is totally blocked (for writes), theoretically you could start writing to one of the nodes while the third node is getting its copy, but you'd need to know which one. Vadim has integrated Xtrabackup as a SST donor method in an upcoming Percona Server + Galera version, which will allow nodes to join and get a copy in a non-blocking fashion - it goes without saying this is a huge improvement.
Results from 3 node cluster
Running the benchmark against a 3 node Galera cluster, and writing in turn to 1 master (blue), 2 masters (red) and 3 masters (yellow), we get the following:
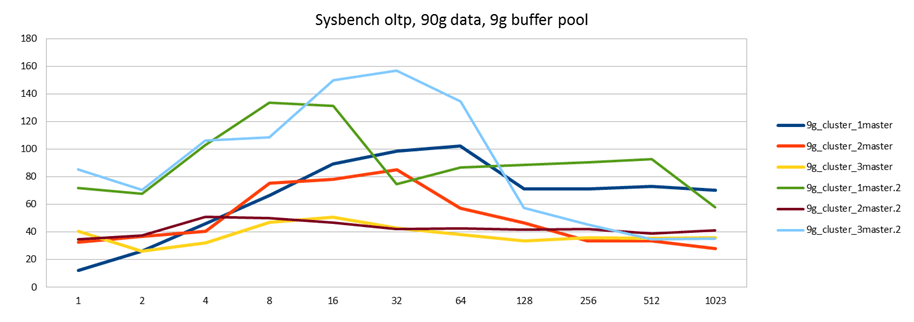
Ok, so that's interesting. Performance actually decreases when we distribute the load against more than one master. To double check the results I ran another set of tests (green, brown, cyan) to confirm. The second set gives different results. For instance one thing that could explain this kind of behavior is that the cache is now more warmed up, so performance would improve compared to the first run (where the blue line is against a newly restarted cluster). In fact, the results suggest that better cache utilization could have produced the better results on the second run. So I script a different test to see if this is the case.
Uneven performance during first 20 minutes
In the following test I did repeated runs of 32 sysbench threads of 2,5 min each, writing to all 3 MySQL nodes. So unlike all other tests, the amount of client threads does not increase, the workload is completely constant over time. But the performance is not:
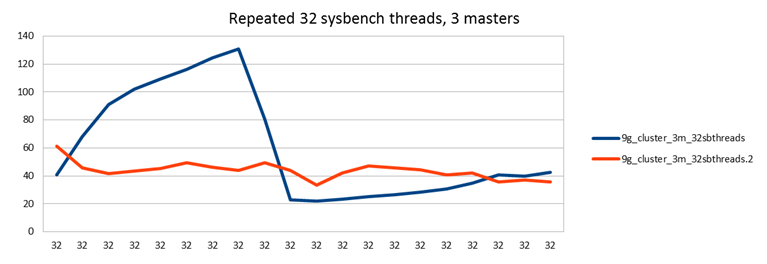
So what happens here is that after restarting the MySQL nodes, performance starts increasing from 40 tps up to 140 tps. This peak happens at the 8th run, so this is 20 minutes into the test. This rise could very well be explained by cache warming up. But then there is a sharp decrease, after which the performance stabilizes back at 40 tps. The red line is a second run, there's been a pause between but no restarting of MySQL, so cache is still warm.
I didn't look too deeply into this behavior, but it seems during the performance drop there is again similar behavior as we saw in the previous tests which was explained by InnoDB log purging. It could of course be something else in InnoDB too. Or it could be a bug in Galera, but with my experience so far this looks very much like an InnoDB issue.
Analysis (part 1)
From this test we learned a few important things:
1) Suspecting the InnoDB log purging (I've seen similar results from other bloggers which were about that) it will be interesting to see Vadim's results from Percona Server 5.5 with Galera, because I know they have worked to improve InnoDB behavior in this area.
2) All other results in this blog are now very suspicious. I'm running relatively short tests of 2,5 min per data point, often with no warm-up runs after restart. So a peak somewhere could very well be simply due to this behavior, instead of anything else. (Even so, we can still interpret a few things from other results.)
3) Both in the previous test and this one, it is my experience that Galera itself works very well and will not get in your way, but unfortunately Galera clustering tends to amplify unwanted behavior on the InnoDB level, in particular issues with log purge. This is a bad news, good news situation: A good InnoDB expert will be able to get very good performance with a Galera cluster, after he understands this point.
Results from 3 node cluster with 18g buffer pool
Just like in the single node case, we see that the best performance improvement can again be had by making more RAM available:
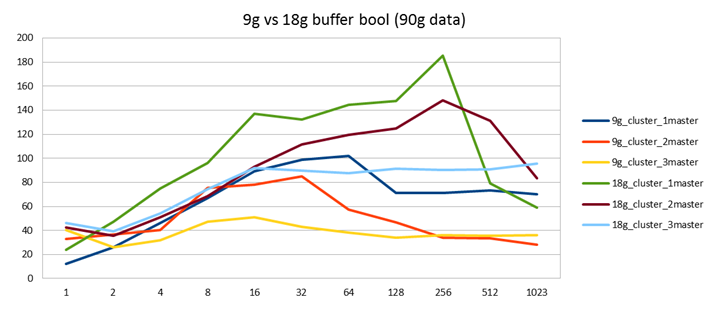
Comparing a galera cluster with 9g buffer pool to another with 18g buffer pools, it seems the benefit from doubling RAM is about 80% performance gain. In fact, it seems like a good rule of thumb that doubling your buffer pool, will compensate for the loss of performance you get due to Galera replication compared to the single node case. (Of course, now you need to double the RAM times 3!)
In both cases performance is better when you direct all clients to a single master and leave the other 2 nodes as slaves (or passive masters, to be precise).
Analysis (part 2)
I have a few more tests I will share separately, but all of my tests just confirm what we've already seen:
1) In a disk bound workload, synchronous Galera replication will give you a performance hit. This seems to derive from InnoDB behavior, so there is probably an opportunity to make this performance degradation small or even negligible with correct tuning. In these tests we see degradation of 10% to 50%. (The wide gap is explained by the uneven performance of InnoDB in a Galera cluster for the first 20-30 minutes.)
2) With this workload, it is better to just connect all clients to a single master. Distributing the load around several nodes, will just make the performance degradation worse.
So why doesn't Galera help us scale here, as it did in the previous tests? This is specific to the sysbench oltp test used here. And I should point out it is an artificial test that doesn't represent well any real world workload I've ever seen.
Sysbench oltp repeatedly executes only 1 transaction: 14 different SELECTs, 2 UPDATEs, 1 DELETE and 1 INSERT. While this can be called a "read-write benchmark", what is significant here is that 100% of the transactions include writes. In the real world, you will have many different transactions, including many that only read. (Ok, sometimes I've seen a master database where all transactions write, and reading is done from a replicated database somewhere else.)
In the previous memory-bound benchmark, we could still see a good benefit from scaling out on more than one Galera node. Why? Because there we were limited by CPU. And by scaling out we can get more CPU's to work. However, in a multi-master cluster scaling out doesn't help in getting more write throughput, because all write transactions are replicated so they have to be done on all nodes. Hence it doesn't matter where they originate, the amount of work - in this case the amount of disk seeks per second - is constant. But note that this is specific to write transactions. If we had a workload that includes read-only transactions, and we were limited by disk-reads for those transactions, we would of course benefit from distributing those reads across several servers.
That explains why performance doesn't increase. It is then easy to speculate that the reason performance also decreases when writing to more than one node has to do with the "flow control" of the Galera replication. Since commit order has to be preserved on all nodes, you get a better performance when all transactions flow in via the same node, whereas replicating 2 ways there is more disorder resulting in more waiting and congestion.
In other words: with a read-write workload where majority of transactions are read-only (such as most web applications) I would still expect to see a benefit from scaling to more than one node. There is no sysbench test that would include such a mixed workload. Perhaps someone could write a TPC-C-like benchmark in Lua?
But even if it's not so realistic, this "worst case" workload does serve very well in teaching us how Galera behaves. Even on a more mixed and realistic workload, one should still consider these results and decide whether it makes sense to just do everything on 1 master or whether connecting to several nodes really has more advantages than disadvantages.
Yet another way to explain what happens here is by comparing to classic MySQL replication: If you were using MySQL replication here, you could still get great performance results on the master, but there would then be terrible slave lag when the transactions are applied on the slave - so the slave is pretty much unusable then. Galera being synchronous does the opposite thing: If the slave is not keeping up, the master is also stalled. The Galera way is preferred.
- Log in to post comments
- 14622 views
Henrik, Getting results in
Henrik,
Getting results in disk-bound case with InnoDB may be tricky.
It may vary very significantly depending on what stage InnoDB right now.
I.e. it will go through warmup stage, then you get to checkpointing etc.
The trend can be very similar to http://www.ssdperformanceblog.com/wp-content/uploads/2011/06/time-sizes… (this is graph not for InnoDB, but to show idea).
What I found helpful is to run sysbench for long period ( could be 1-3h) with
reporting results each 10sec ( you can do it with --report-interval=10),
then graphing it will help to understand how throughput varies during this time
and when you can expect more or less stable line.
Yes, this became very clear
Yes, this became very clear in this test. In fact I think a Galera cluster then amplifies InnoDB behavior: if InnoDB is stuck, Galera is stuck times three :-) Anyway, by the time I realized how much InnoDB behavior changes I had already done most tests. I think some qualitative observations can still be made, even if in some case I can't say if the performance penalty is 10% or 50% or something else.