Update 2012-01-09: I have now been able to understand the poor(ish) results in this benchmark. They are very likely due to a bad hardware setup and neither Galera nor InnoDB is to blame. See https://openlife.cc/blogs/2012/january/re-doing-galera-disk-bound-bench…
People commenting on my results for benchmarking Galera on a disk bound workload seemed to be confused by the performance degrading when writing to more than one master, and not convinced at my speculations on the reasons. Since sysbench 0.5 has the benchmarks in the form of LUA scripts, it was temptingly easy to tweak those a little to see if my speculations were correct. So yesterday I did run tests again with a slightly modified sysbench workload. (Everything else is identical, so see previous article for details on the setup.)
So my analysis of the previous results were that
a) the fact that all transactions in sysbench oltp include writes, means that all of them have to be replicated and will be delayed on commit. For reasons unknown this delay becomes larger when writing to multiple masters.
b) Sysbench oltp is not a very realistic benchmark, it just executes 18 diferent queries in sequence and then commits. In the real world you of course have a mix of different transactions, some containing only reads and some containing reads and writes, and most of them containing much less than 18 queries. From (a) it follows that such a real world workload would perform better on a Galera cluster.
So I modified sysbench/tests/db/oltp.lua to a new test which I called oltp-short.lua, where I essentially split the long transaction into 8 shorter transactions: 5 different kinds of selects (some run more than once), 2 updates and 1 transaction with delete+insert. For each call to event() one of these is then randomly chosen. This is still a very simple and synthetic benchmark but more realistic than the previous one.
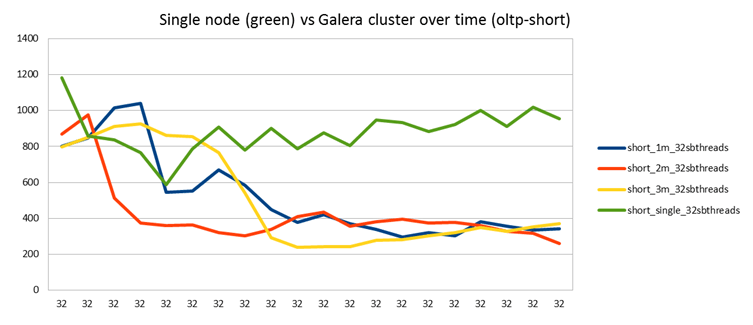
I also learned during the previous tests that during warm up of InnoDB caches performance can vary a lot. So let's start each test with restarting the MySQL servers and running a series of 2,5 minute runs with 32 sysbench threads being a constant.

(Note that these transactions are now smaller than those in all my previous tests, so numbers are not directly comparable.)
There is a small difference but by and large the behavior is the same. First we get up to 1000 tps, but after a while it goes down and settles at 400 tps. While I haven't investigated this closely, the theory here is that once the buffer pool is filled, and/or InnoDB log file becomes full, InnoDB has to start working on flushing pages back to disk, to make room for new pages/transactions. I've seen people reporting this kind of behavior from InnoDB also in single node cases.
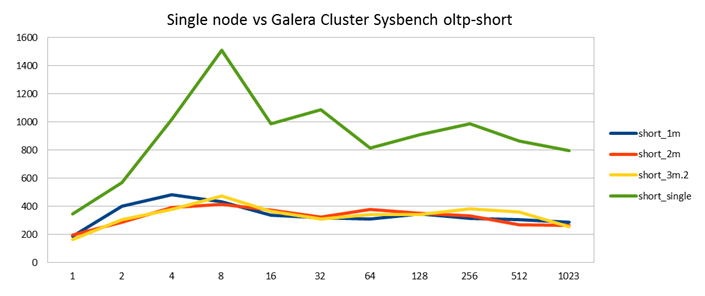
After such a varm up run to stabilize the performance, I then ran the same benchmark with an increasing number of threads. Each of the following runs were run after the corresponding warm-up run, ie the red line here is a continuation from the red line in previous picture, etc.

Again we see that performance is pretty much identical whether you write to 1, 2 or 3 nodes.
This is unlike the previous test, where writing to more than one master degraded performance. My explanation here is that since this workload contains also read-only transactions (62.5% of them), the workload is less blocked by waiting for replication to happen, since those transactions don't need to be replicated they can just go ahead on the local node. This allows for more work to proceed in parallel. (In fact, I would also expect reading from multiple masters to increase performance, but that doesn't happen here. This is probably because also reads are slowed down by the InnoDB issues explained next.)
And like I said, this is also a more realistic example of a disk-bound workload than the previous one with the standard sysbench oltp test.
Finally, what remains is a comparison of the same workload against a single MySQL node (green).


As you can see, in the single node case we don't see the same degradation in performance after the warm-up period. Hence also the results for sysbench with various amounts of threads is much better.
So doesn't this result suggest that Galera is to blame? Yes, kind of. But when you look at things like SHOW PROCESSLIST when running these tests, it is clear that Galera is mostly waiting for the InnoDB engine. Symptoms are the same as in my first tests when I had left innodb_log_file_size too small. So it seems clear this is an InnoDB issue. Of course, it's an interesting question why it is only seen together with Galera and not in the single node case executing the same queries. This answer is not known to us today.
I don't intend to explore this direction further for now, but any of the following could help to get better performance for this kind of workload:
- This is an area where InnoDB has problems in some workloads and both Percona and Oracle have been tweaking the heuristics of when to purge the log files. So first of all it will be interesting to see if Percona Server 5.5 will behave any better with Galera.
- There are InnoDB parameters available where I could tune the behavior of log file purging. I'm optimistic I could get better results with them, but I'd still like to know why a Galera cluster makes InnoDB behave differently than a single node.
- There are also Galera parameters that could be relevant, for instance I could increase the size of the queue that hold transactions waiting to get written into InnoDB. But my gut feeling is this would only delay the inevitable: transactions get stuck waiting for InnoDB.
- Log in to post comments
- 12785 views

MySQL 5.5 version is on the way
Hi Henrik,
Nice work, your benchmark probably simulates some real world use cases quite well.
To understand this behavior and optimize the server would require monitoring InnoDB buffer pool and disk IO activity in detail. Probably there are severe peaks in performance due to InnoDB checkpointing.
Good news is that both Oracle and Percona have worked in fixing InnoDB with this respect, a lot has happened since MySQL 5.1. We are working on merging the wsrep patch in MySQL 5.5, and we have currently a beta release under testing. We call this release MySQL/Galera 1.0beta and it is based on MySQL 5.5.13. You can expect 1.0 GA release during September.
I think it makes sense to rerun this benchmark with MySQL/Galera 1.0, and not spend much time in optimizing MySQL 5.1 which is more or less old technology by now.
-seppo
Thanks for the news. Yes,
Thanks for the news. Yes, this was the reason I didn't bother to even look at the relevant InnoDB parameters to tune log purging, since I know InnoDB has changed in this area anyway, it just makes sense to return to this on a 5.5 base.